
Features
Dashboards
A dashboard puts the numbers you check every day on one page: open and overdue work, today’s schedule, how much got done, and data from the tools you’ve connected, like Square sales or QuickBooks. Build one widget by widget, or describe it and let AI build it.
Who can use Dashboards
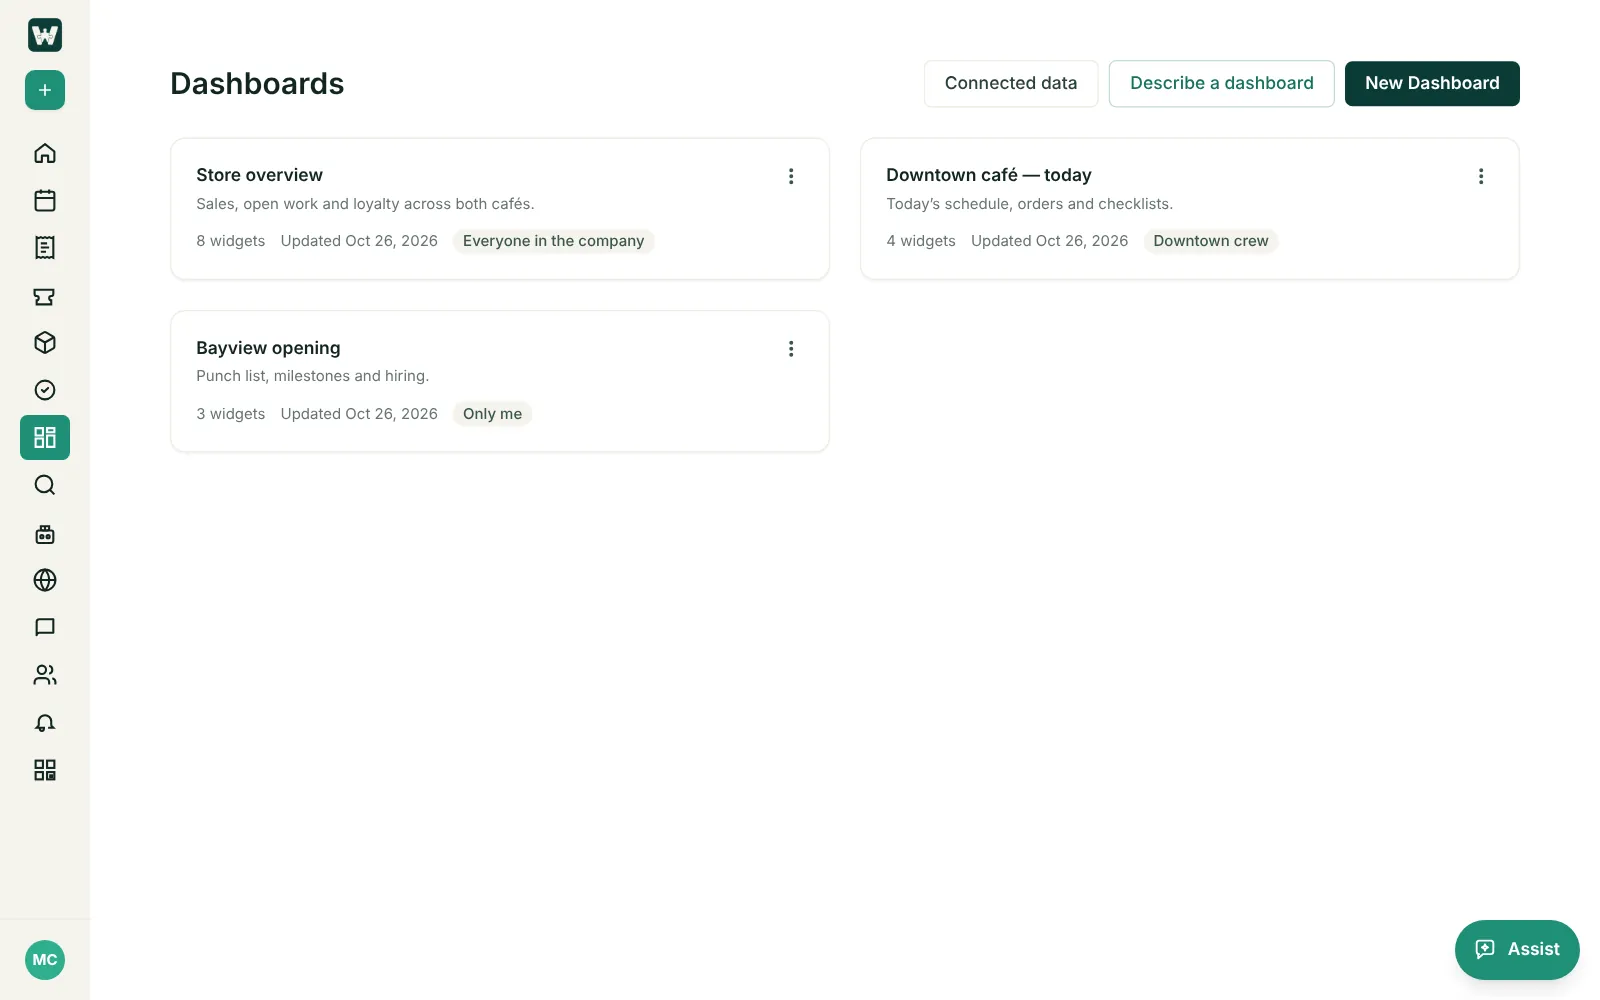
Anyone who can see tickets. Open Dashboards in the sidebar to see the dashboards you made and the ones shared with you. Each card shows how many widgets it has, when it was last updated, and who can see it.
If you don’t see Dashboards in your sidebar, a System Admin turns it on in Admin console → Work Configuration → Modules. It doesn’t need any other module.
Create a dashboard
- Open Dashboards and click New Dashboard.
- Give it a name and, if you like, a description.
- Under Show tickets from, keep All products, projects and locations, or pick one — for example, one dashboard per café.
- Choose who can see it, and save. The dashboard opens, ready for widgets.
Or click Describe a dashboard and let AI build it.
Add widgets
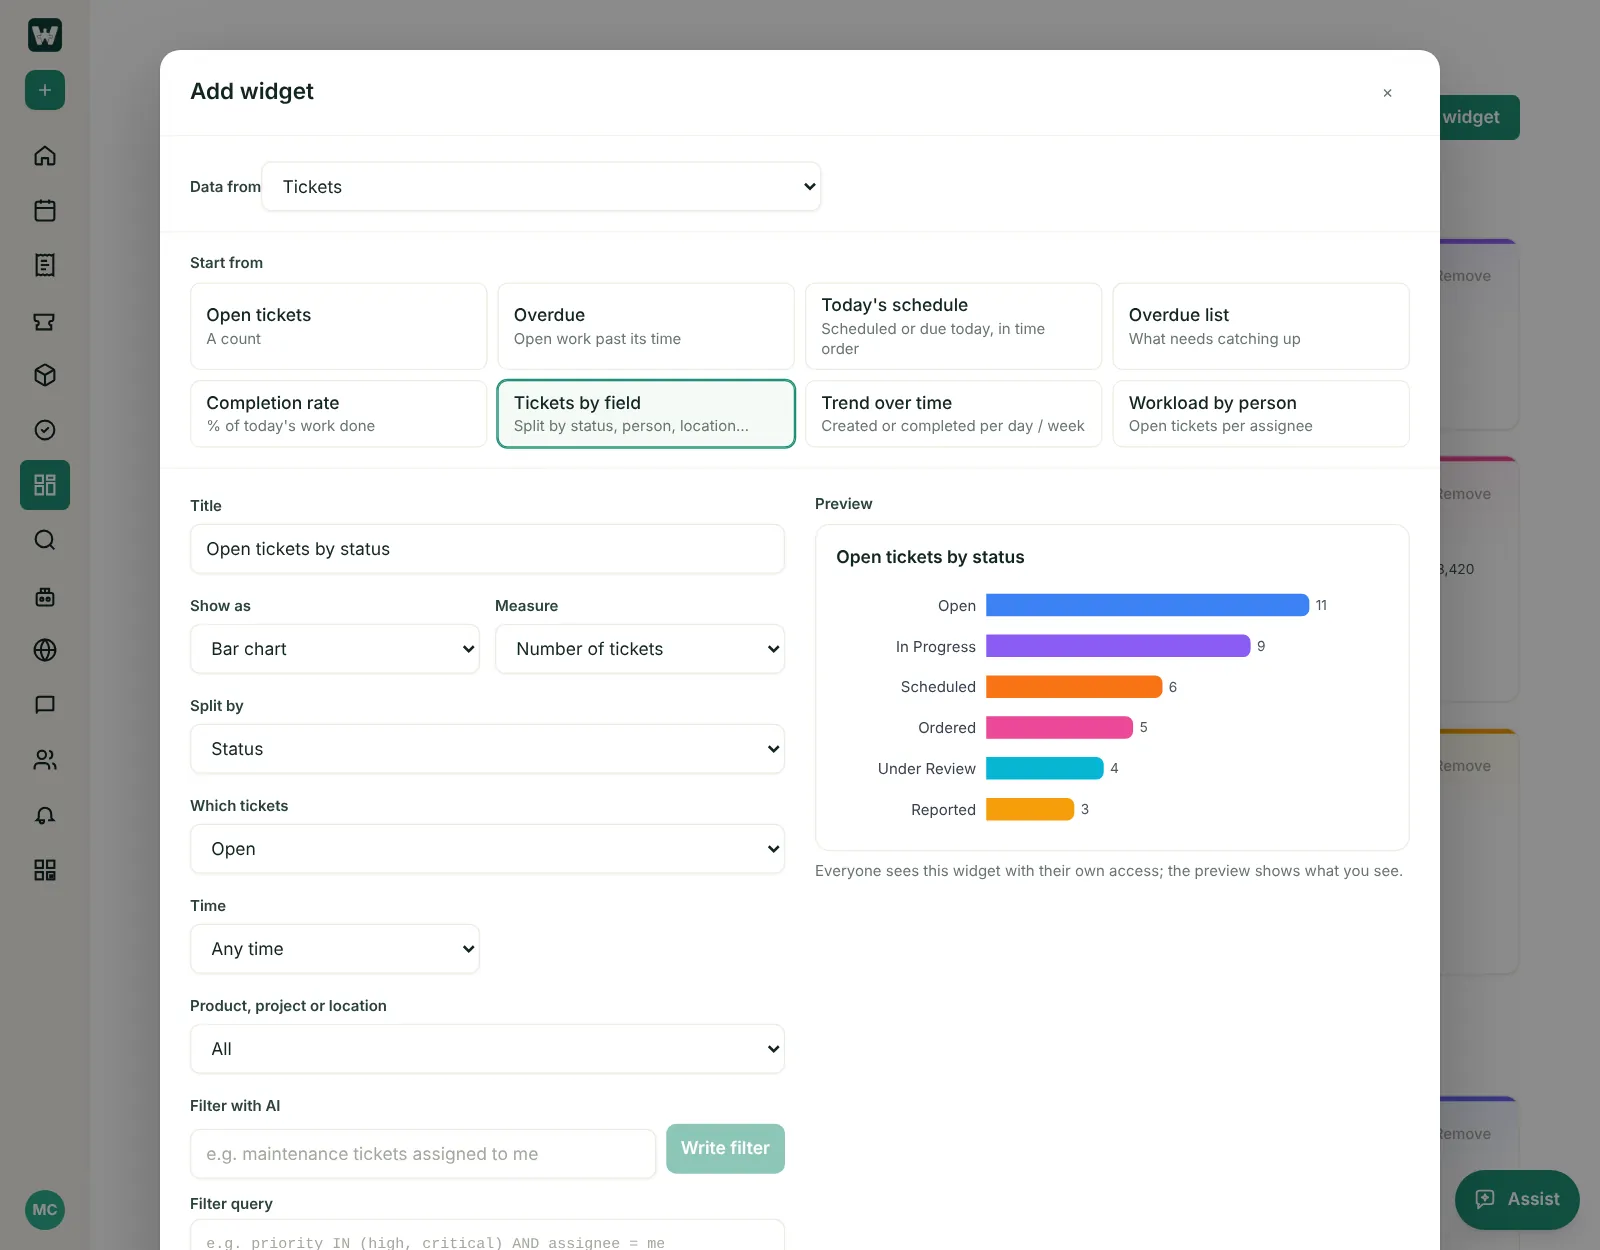
Click Add widget. Start from a ready-made widget, then change anything you like — the preview updates as you go.
- Ready-made: Open tickets, Overdue, Today’s schedule, Overdue list, Completion rate, Tickets by field, Trend over time, and Workload by person.
- Show as: a number, a bar chart, a trend over time, a table, or a list of tickets.
- Measure: number of tickets, % done, story points, or hours logged.
- Split by status, priority, ticket type, assignee, reporter, work area, release, sprint, or severity.
- Which tickets: all, open, done, or overdue — and when, by created, updated, due, scheduled or completed date: today, this week, the next 7 days, the last 7, 30 or 90 days, this month, the last 12 months, or all time. A trend counts per day, week or month.
- Narrow it down to one work area, or with a filter: type it in plain words under Filter with AI and click Write filter, or write a Worklynq Query yourself.
- Width: one column, two columns, or full width.
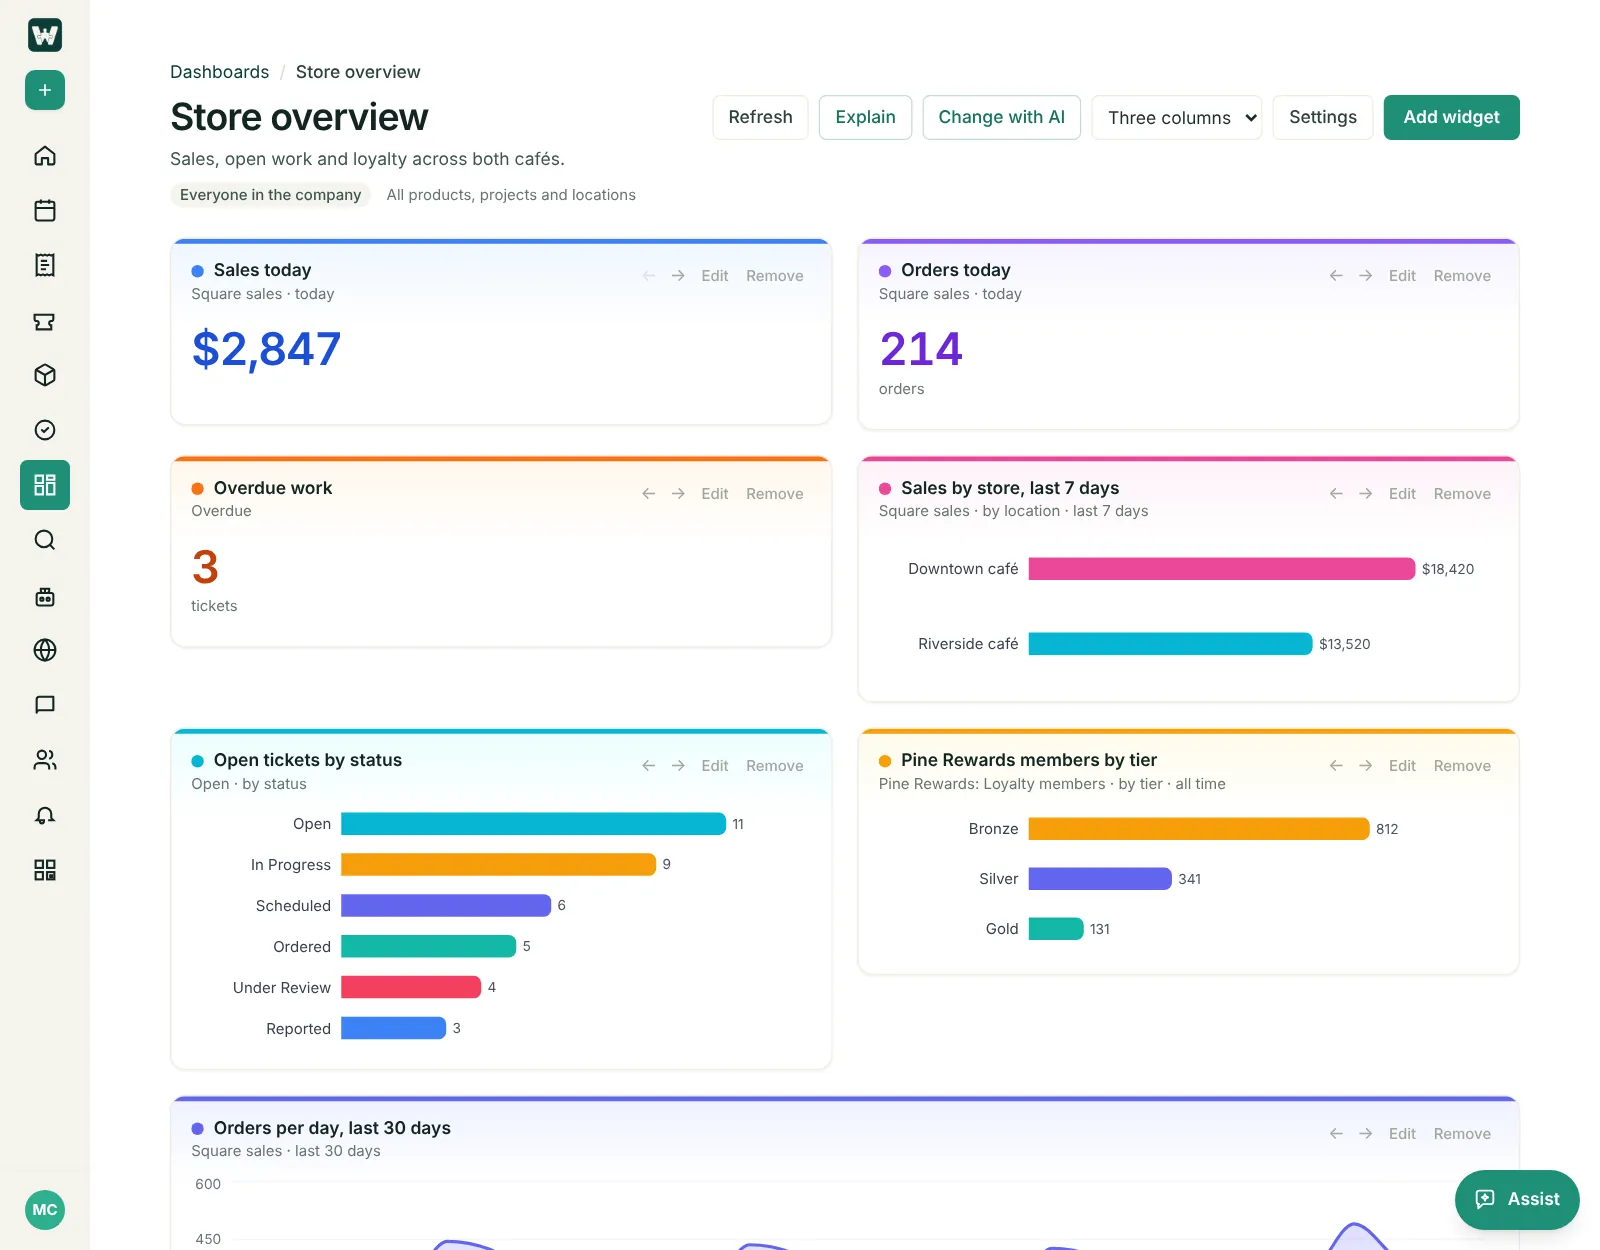
Each widget gets its own color, so they’re easy to tell apart. On the dashboard, use the arrows to move a widget, Edit to change it, or Remove. A dashboard holds up to 40 widgets.
Data from your other tools
Widgets aren’t only about tickets. Under Data from, pick any tool your company has connected:
| Data from | For example |
|---|---|
| Square sales | Sales today, sales per day, sales by location, top items, busy hours, average order |
| QuickBooks | Net income this month, profit and loss, invoices and overdue balances by customer |
| Your own apps | Anything your app shares — loyalty members by tier, bookings, visits |
| GitHub pull requests | Merged per week, time to merge, by repository, recent pull requests |
| Gmail (company mailbox) | Emails per day, emails today, who emails you |
| Coding agents (Claude, Cursor) | Runs, pull requests opened, and spend |
Who can use each tool’s data
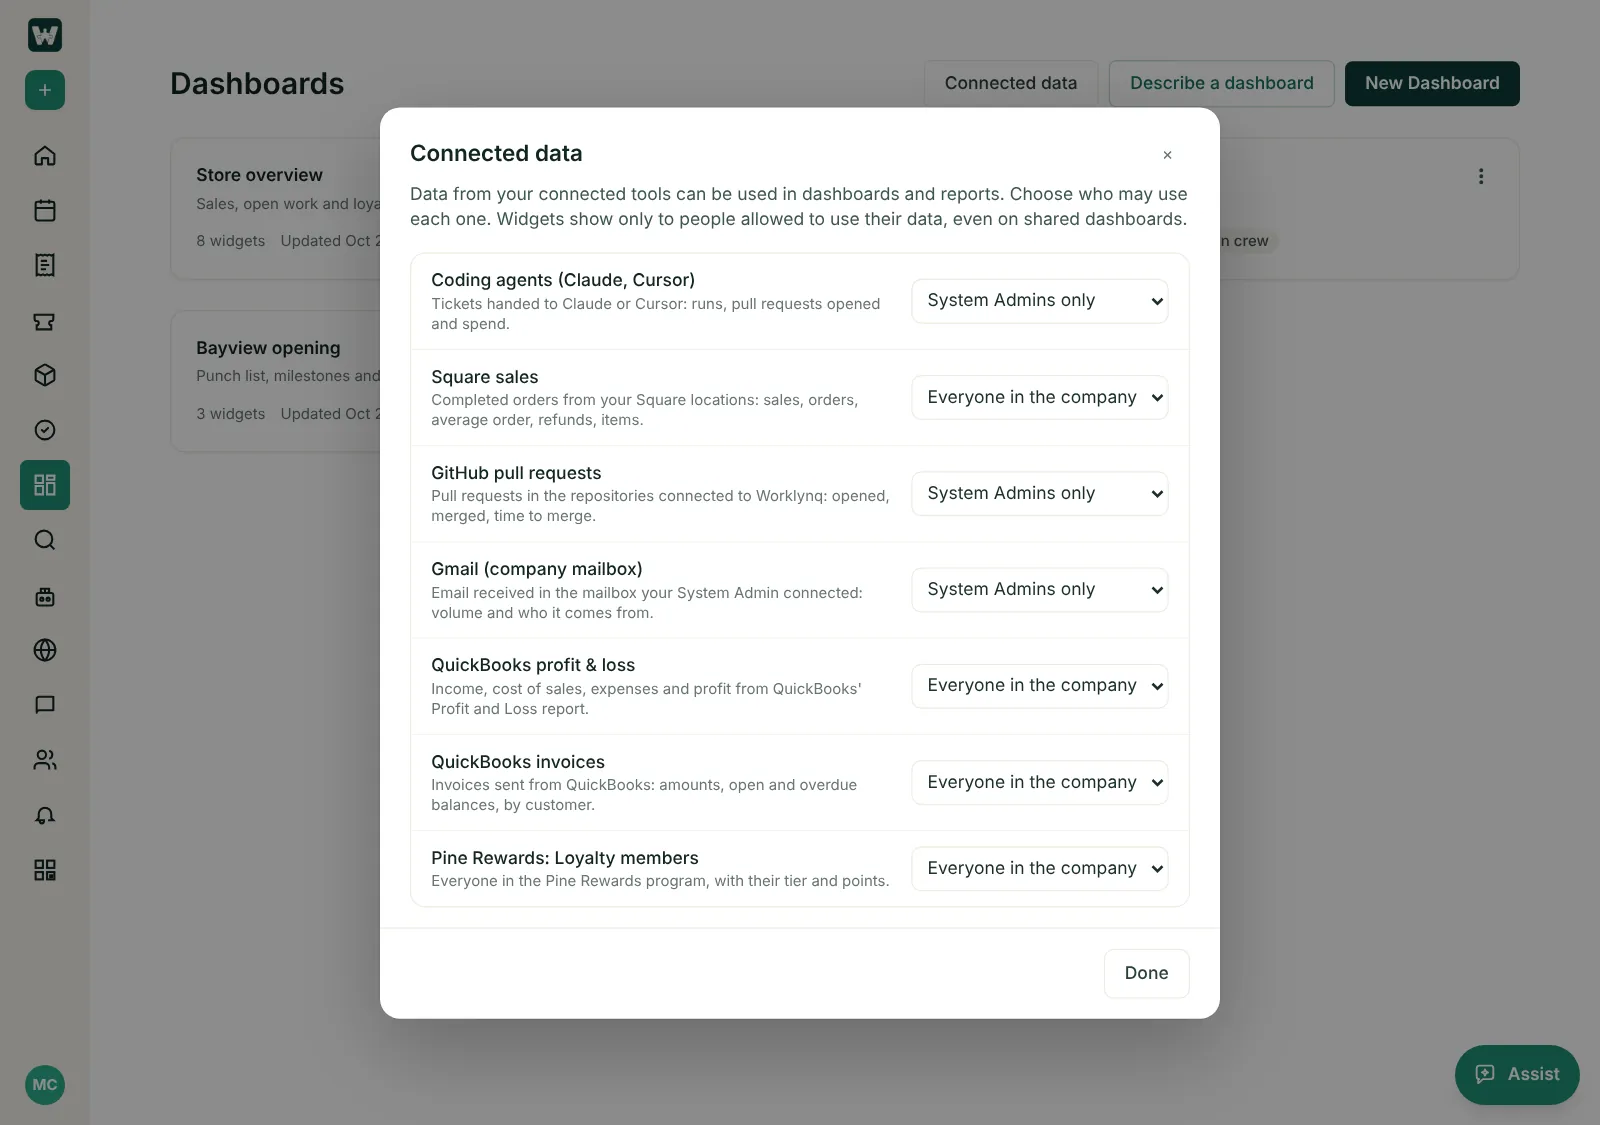
A System Admin decides who may use each connected tool’s data: click Connected data on the Dashboards page and choose Everyone in the company or System Admins only for each one. A widget only shows to people allowed to use its data, even on a shared dashboard.
Build and explain with AI
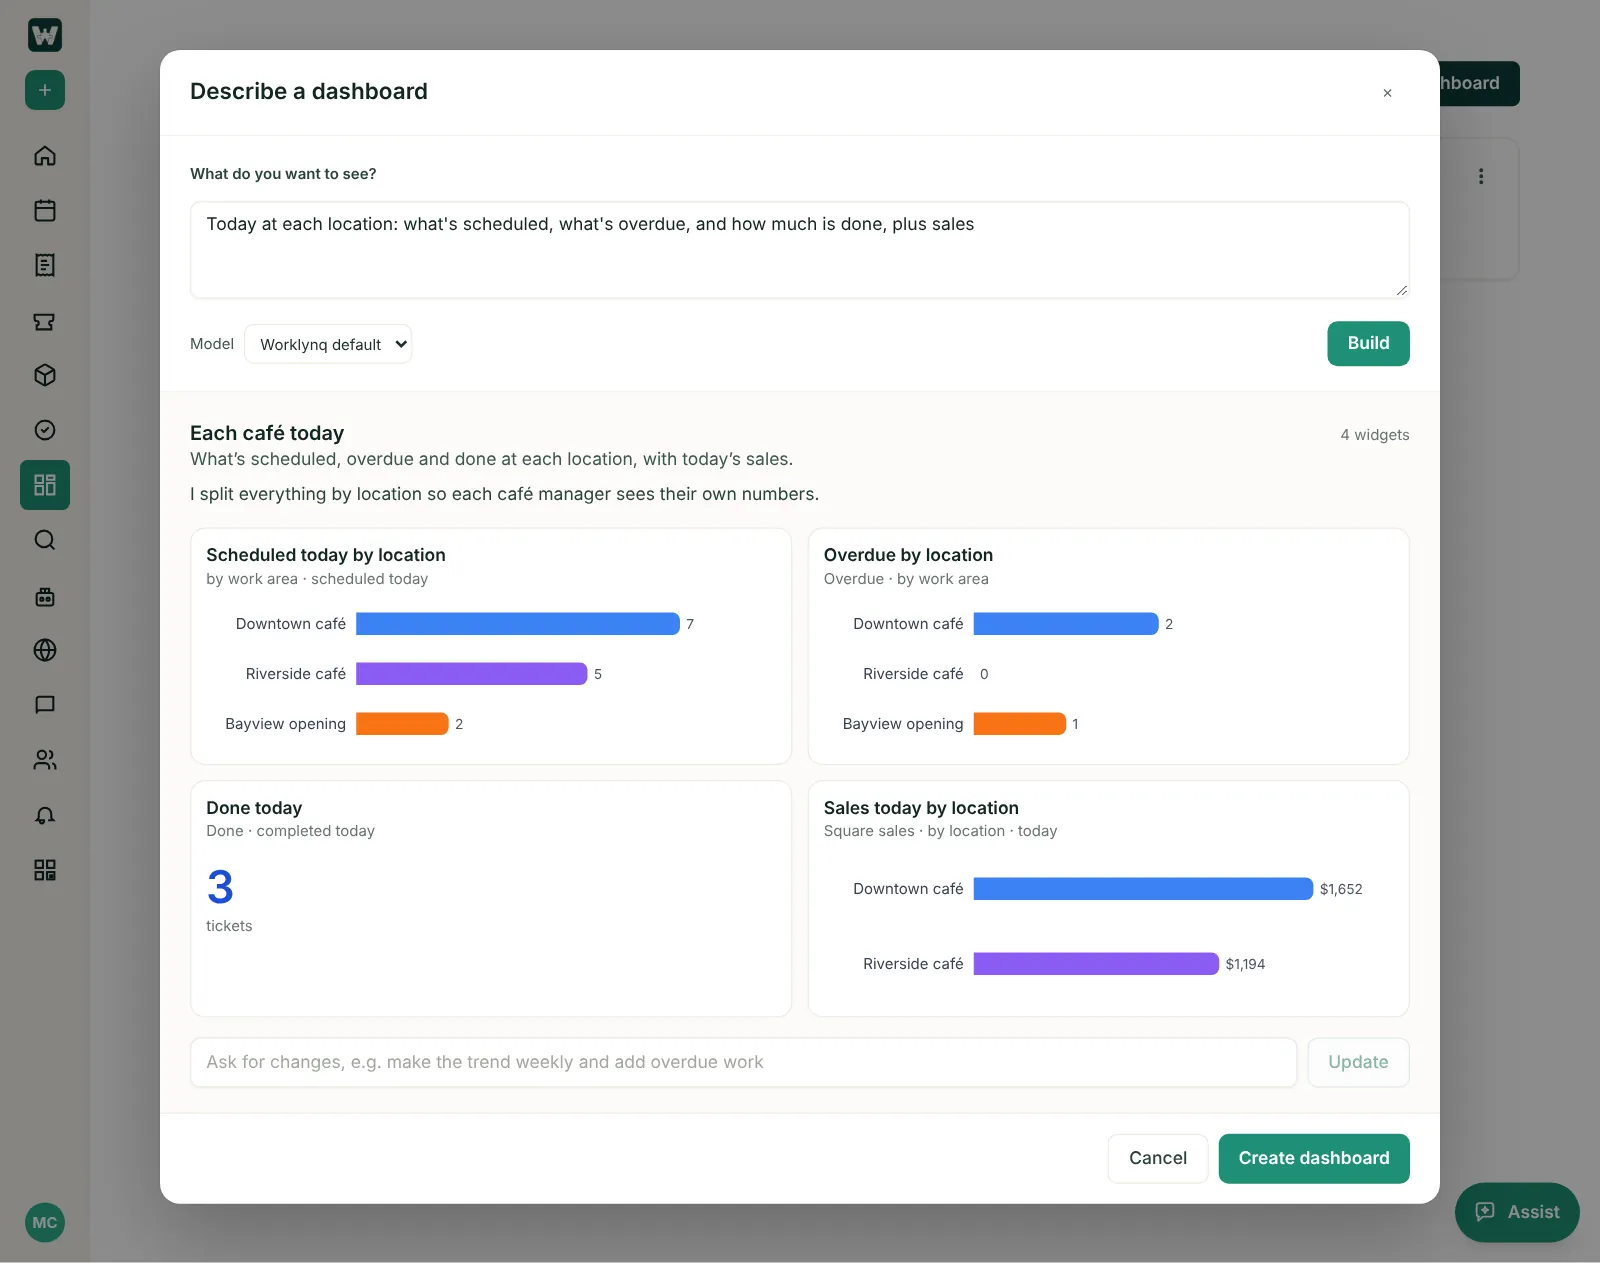
- Describe a dashboard. On the Dashboards page, say what you want to see — “today at each location: what’s scheduled, what’s overdue and how much is done, plus sales” — and click Build. AI picks the widgets and shows a live preview. Ask for changes in the box below it, then click Create dashboard. Nothing is saved until you do.
- Change with AI. On a dashboard you can edit, describe what to add, change or drop, and preview it before you save.
- Explain. AI tells you in a few points what the numbers say right now — what’s up, what’s behind, what to look at first.
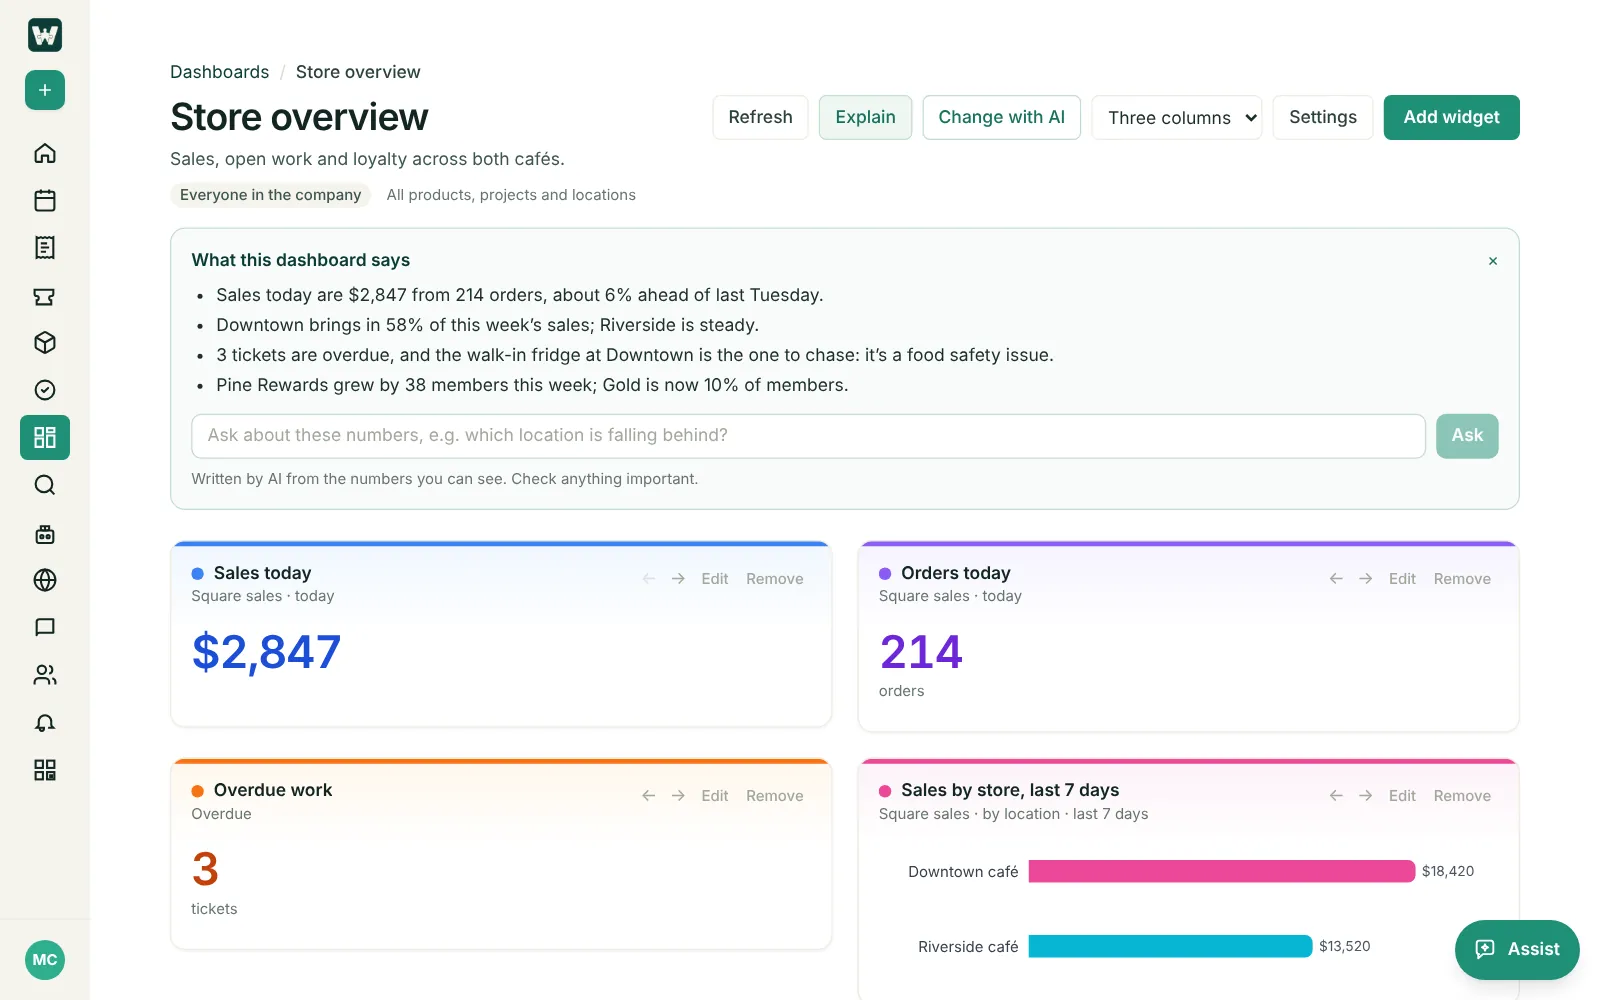
AI uses Worklynq’s own AI, or a Claude or OpenAI model your company has set up, and uses your company’s AI credits. You can also ask Assist “what does this dashboard show?” with a dashboard open, or build and read dashboards from your own AI app.
Share a dashboard
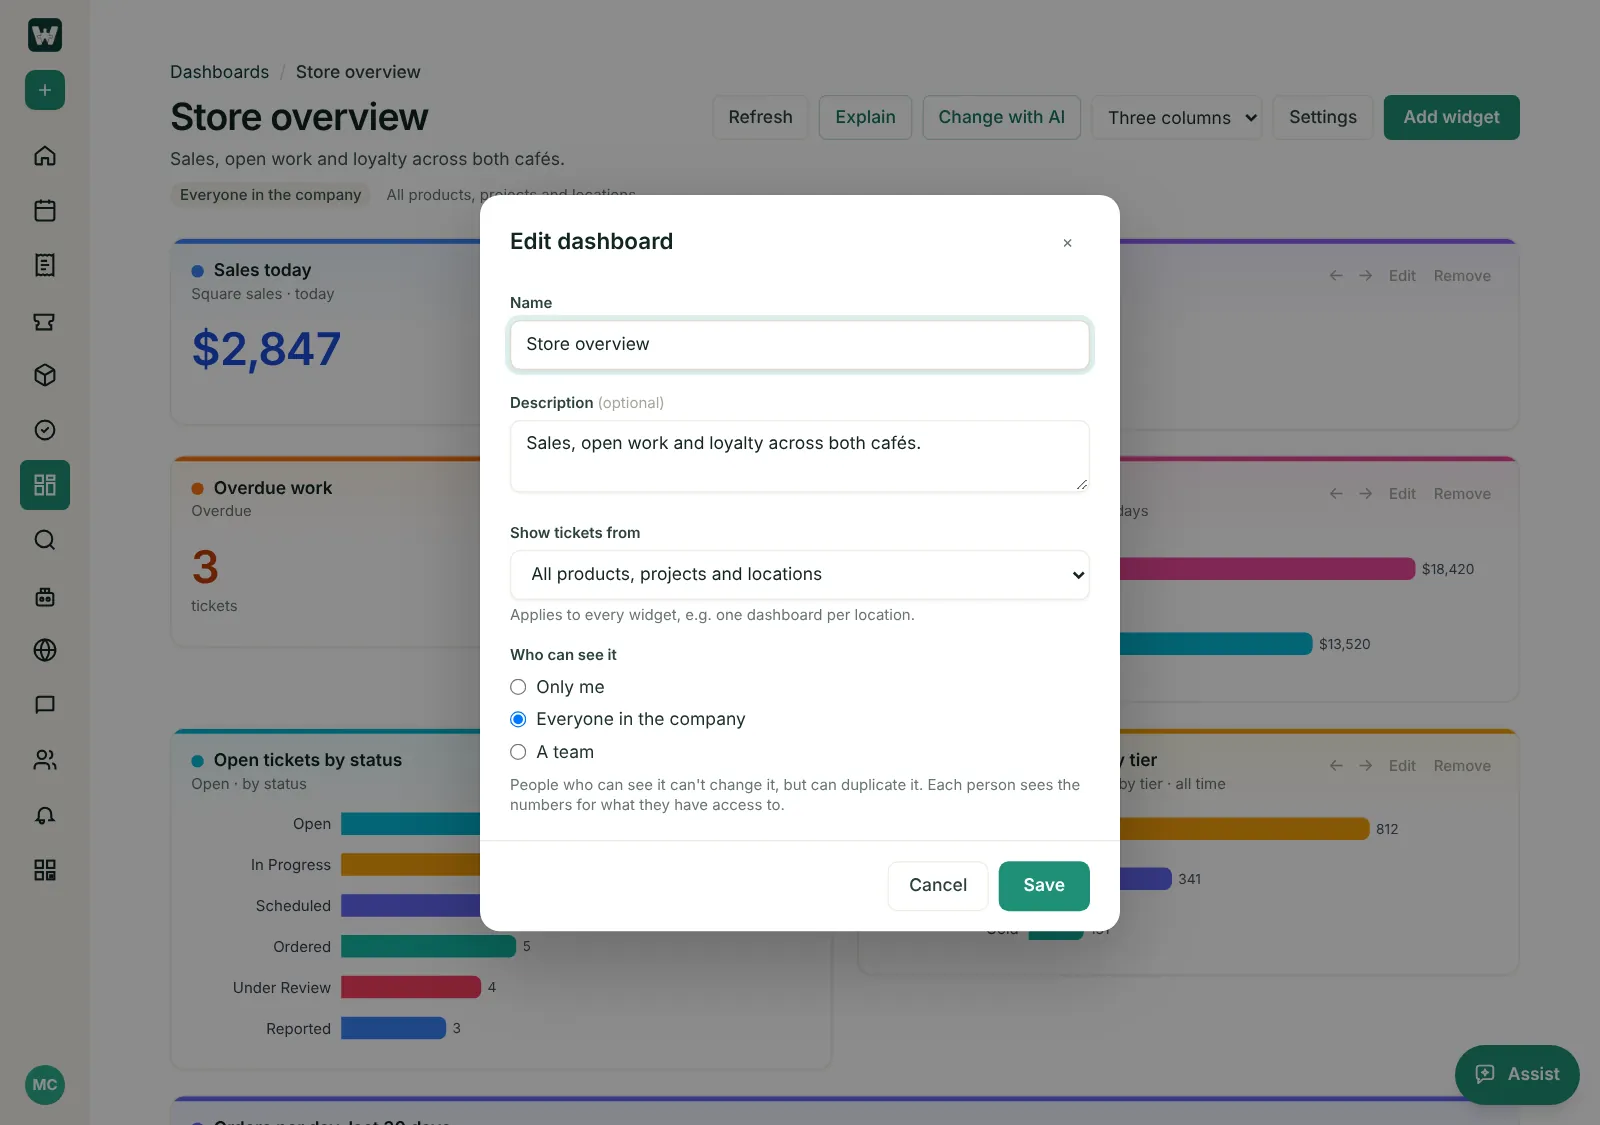
Click Settings on a dashboard to rename it, change which work area it shows, or choose Who can see it:
- Only me — the default for a new dashboard.
- Everyone in the company.
- A team — pick which one.
Other people you share with can’t change your dashboard, but they can Duplicate it to make their own copy. Everyone sees the numbers for the work they have access to, so a shared dashboard never shows anyone tickets they couldn’t open.
Keep it tidy
- Layout: one, two, or three columns. Three columns needs a wide window; on a smaller one the dashboard shows two.
- Refresh updates every widget. The numbers are worked out when you open the dashboard.
- From a dashboard card’s menu, Edit, Duplicate, or Delete it. Only the person who made a dashboard, or a System Admin, can change or delete it.
- Your company can keep up to 500 dashboards and scheduled reports.
Dashboards for projects and versions
Every project and every product version gets its own dashboard, ready-made with widgets for its tickets. Anyone can change them, with Change with AI too, and Reset widgets puts the defaults back. They belong to the project or version, so they aren’t listed under Dashboards and can’t be deleted.
Want the numbers in your inbox? Scheduled reports email a set of widgets on a schedule, with an AI summary.
Last updated: November 6, 2026. Questions? info@cohesync.com